
Bitcoin is currently stuck in the $60,000 to $70,000 range, with conflicting signals permeating the market. On one hand, the Fear and Greed Index hit a historical low of 5 on February 12, indicating extreme pessimism. On the other hand, on-chain data paints a more balanced picture: despite a nearly 46% drop from the $125,000 historical high in Q4 2025, the Bitcoin network is undergoing a silent "reset."
Bull-Bear Tug-of-War: Fear of Old Coins Moving vs. Institutional Long-Term Accumulation
Current market sentiment is being pulled by two opposing forces:
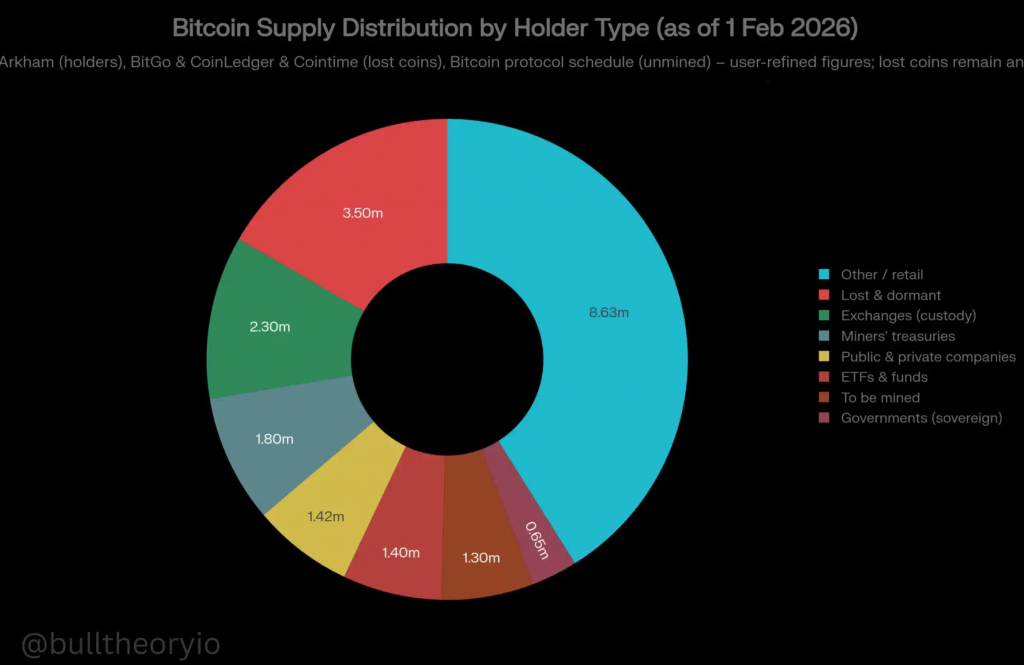
- Bearish Concerns: There are fears that around 3.5 to 4 million long-dormant Bitcoins (known as "sleeping supply") could suddenly move due to advancements in quantum computing, increasing supply and pushing prices down.
- Bullish Reality: Since 2020, institutions and ETFs have cumulatively bought about 2.5 to 3 million Bitcoins. In this cycle alone, nearly 13 to 14 million Bitcoins have changed hands, setting a record for historical trading volume without a system collapse. This suggests that price weakness is more about repricing in uncertainty rather than systemic collapse.
Network Resilience: Difficulty Adjustments Protect Miners, Developers Prepare for Quantum Resistance
The underlying mechanisms of the Bitcoin network are playing a stabilizing role. Following the price drop, mining difficulty automatically adjusts downwards, allowing remaining miners to maintain profitability and ensuring network security.
At the same time, the developer community is actively researching quantum-resistant solutions, with newer wallet types offering higher security. This indicates that fears of old coins being mass-hacked may be exaggerated.
Demand Warning Signs: Declining Active Addresses and ETF Fund Outflows
However, short-term demand does show warning signs. The number of active addresses has continued to decline since peaking on February 6, indicating cooling real user activity. Retail investor interest is waning, and trading volumes are slowing.
Despite a small inflow of $133 million into spot Bitcoin ETFs on February 13, the overall trend has exhibited funds flowing out for several consecutive weeks. This means that prices are currently more affected by risk-reduction measures from large institutions rather than strong spot demand support.
Market Divergence: Is $60,000 the Bottom or a Midway Station?
Opinions on the current price range of $60,000 to $70,000 are sharply divided:
- Optimists: View this range as a solid foundation for future rebounds.
- Cautious Analysts: Willy Woo warns that rising volatility may indicate a strengthening downward trend and that the true bottom may not yet be reached.
At the same time, signs of capital diversion are emerging. Barry Silbert, founder of Digital Currency Group, predicts that as blockchain tracing technology undermines Bitcoin's anonymity, about 5% to 10% of Bitcoin funds could shift toward privacy-focused competing coins.
Conclusion: Bitcoin Faces Deep Questions About Its Role
In summary, Bitcoin is not just undergoing a price correction; it is facing profound questions regarding its role in an evolving market. It must address multiple challenges from macro sentiment, technological changes (quantum computing), and capital diversion (privacy coins).
If the $60,000 barrier can be effectively defended, there’s still a possibility for recovery within 2026. However, if volatility continues to rise, the market may face further declines. For investors, the current contradictory picture serves as a reminder that understanding on-chain structures may be more important than predicting short-term prices.


